The following is a transcription of a presentation that I delivered at the Capital as Power: Broadening the Vista conference at York University, Toronto, 28-30 September, 2016, and at the Intersections of Finance and Society conference at City, University of London, 3-4 November, 2016.
INTRODUCTION
Today I’m going to discuss some ideas from a new research project that I’ve just started on corporate taxation. And specifically, I want to present for you just a small snippet of the research that I’ve managed to conduct thus far.
This preliminary research addresses a very simple question that hasn’t been adequately explored in the existing literature: How do the income tax rates of the largest corporations in the United States compare historically to average corporate income tax rates?
Why is this an important question to address? To put it simply, I see taxation as one of the key battlegrounds where corporate power is exercised and contested within contemporary capitalism. If large corporations are paying lower than average rates, then this may point to the growing power of big business in the global political economy.
Now, the data that I’m going to present for you points toward a worrying trend. What my research shows is that over the past couple of decades the top 100 corporations in the United States have consistently beaten the average rate of corporate taxation. And so this means that giant corporations have become remarkably adept at reducing their relative tax burden in recent years.
EXISTING LITERATURE
Before presenting my preliminary research findings, I want to set the scene by discussing how issues of corporation taxation and corporate power have been dealt with in the existing literature.
As I’m sure you’re aware, corporate taxation has become a hot button issue in recent years. If you open up any newspaper or visit any news website, you’ll find daily reports of some tax scandal involving dominant corporations.
Now, within the field of IPE, there’s been plenty written on the transformation of corporate tax regimes over the past few decades. There’s also been plenty of debate about whether globalization is leading to the convergence of corporate tax policies around the world.
These issues of changing tax regimes and tax policies are obviously important. But what I think is lacking within the IPE literature is any systematic study of the corporations themselves. In other words, what is missing from IPE is an analysis of the strategies that the world’s most powerful corporations employ to try to reduce their tax burdens. And I think that this is a serious oversight because some researchers have suggested that dominant corporations play an active role in undermining the state’s capacities to tax them.
What about outside of IPE? There is in fact a small body of literature in political science, sociology, and accounting that deals directly with corporate tax strategies. And this literature has made efforts not only to empirically map effective corporate tax rates, but also to theorize these empirical patterns in terms of power.
The following diagram illustrates the commonalities that can be found within the literature on corporate taxation.
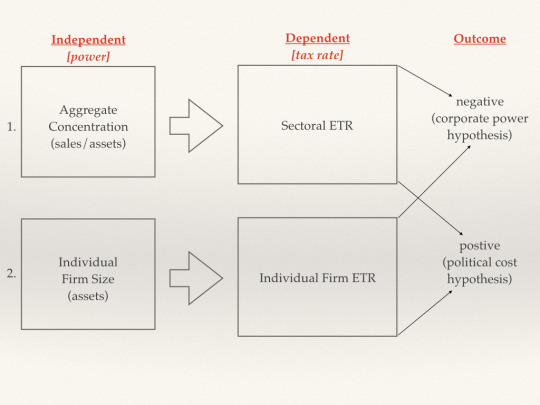
As you can see, it is common for researchers to empirically analyze the relationship between corporate power and effective corporate income tax rates (the effective tax rate is the actual amount of taxes that corporations pay as a percentage of their income).
Usually these studies are based on some sort of linear regression, using either univariate or multivariate models. The common proxy used for corporate power is corporate size, which serves as the independent variable. So researchers take either the aggregate concentration ratio for assets or sales, or they look at individual firm size, usually measured by total assets. And they look at the correlation between these proxies for corporate power and the dependent variable, which is the effective tax rate.
The effective tax rate these studies use is for entire sectors or for individual firms. On the one hand, if the statistical analysis reveals a negative relationship between the two variables, then this is seen as evidence for the “corporate power hypothesis”. This is the idea that large corporations use their vast resources to influence politics in order to lower their effective tax rate. On the other hand, if the statistical analysis reveals a positive relationship between the two variables, then this is seen as support for the “political cost hypothesis”. This hypothesis states that large corporations are subject to more public scrutiny and are therefore less likely to get away with aggressive tax reduction.
-So this is the state of the art when it comes to research on power and corporate taxation. And what’s interesting to note about the existing literature is that there’s been absolutely no consensus, even when the studies examine the same countries and the same time periods. Some studies find support for the corporate power hypothesis, some for the political cost hypothesis, and others find no systematic relationship between corporate size and effective tax rates. And so what this means is that researchers can’t agree on the basic facts.
For my purposes, the most important limitation of the existing literature is that it can’t answer the simple question that I raised earlier;And that is the question of how the tax rates of large corporations compare to the average. Before we even start to delve into the relationship between power and the pattern of taxation, I argue that we need to tackle this question. And the very design of the existing analyses prevents them from doing so.
The problem with the first type of study in the diagram lies with the dependent variable. These studies examine the relationship between aggregate concentration and the effective tax rate for entire sectors. And if you look at the tax rate for an entire sector, then there’s no way of differentiating between large and small corporations.
The second type of study in the diagram is potentially more useful. By focusing on individual firms, these studies allow us to gauge whether there is indeed a meaningful relationship between firm size and firm tax rate. But these studies are still limited because they don’t tell us much about the class dimensions of corporate taxation. In other words, because they examine individual firms, these studies don’t reveal anything about the dominant corporations at the heart of the system.
And finally, the problem with both types of studies is that they are static. Since the results are reported in a regression table, we have no indication of how the relationship between corporate power and taxation evolves over time. And this is very problematic for those of us who treat power as a dynamic, rather than a static, concept.
LARGE CORPORATIONS VERSUS THE AVERAGE
Alright, so what I want to do now is present for you some of the preliminary research I’ve done on the taxation of large corporations in the US. And that research is shown in Figure 1 below.
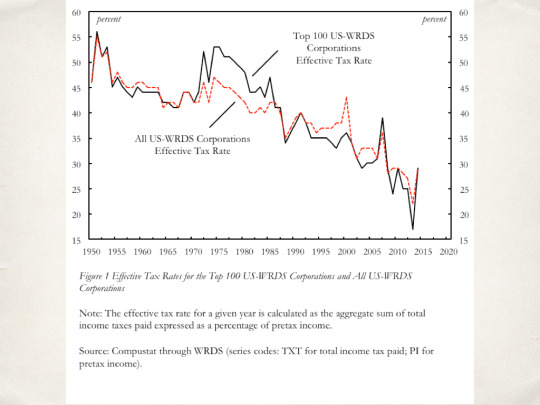
What the figure does is plot the effective tax rate for the top 100 US corporations in the WRDS database, as well as the effective tax rate for all US corporations in the WRDS database. The effective tax rate in the figure is an aggregate measure. So, for example, instead of just averaging out the effective tax rates for each individual corporation within the top 100, I add up the total taxes paid by the top 100 corporations in a given year and I divide it by the sum of the total pretax profits earned by the top 100 corporations.
This aggregate measure is used because it solves problems where an individual company might have a negative pretax income, but might pay some income tax. In that scenario, the results would appear erroneously as a negative income tax rate.
Alright, the first thing that stands out in Figure 1 is the massive decline that we see in the effective tax rates for the top 100 and for all corporations. Essentially, the effective tax rate for both has been cut in half over the past half century.
Now, on the surface of things, the data in this figure might seem a bit unremarkable when it comes to the question of relative taxation. If you just take a causal glance at the two series, you can see that they follow the same pattern. There aren’t any massive gaps suggesting that the top 100 face significantly lower tax rates.
But I think the results become much more significant when we look at them in the context of Table 1 below.
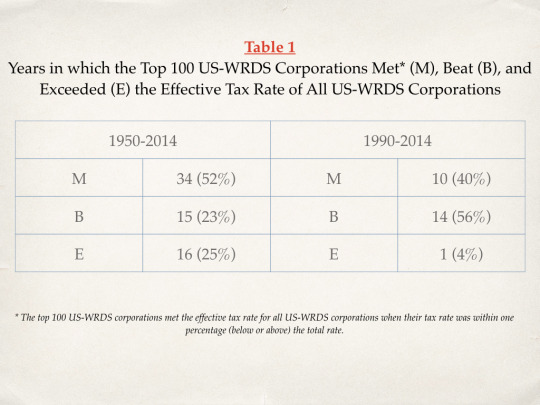
What I’ve done in this table is split the data into two time periods. The first time period covers all of the available years from 1950 to 2014. And the second period covers 1990 to 2014. For each time period I’ve counted the number of years in which the effective tax rate for the top 100 corporations has either met the average, beat the average, or exceeded the average. And when viewed in this context, I think the results become much more interesting.
Over the whole time period, we see that it’s most common for the tax rate of the top 100 to meet the average. For half of the years the tax rate of the top 100 met the average, for a quarter of the years it beat the average, and for a quarter of the years it exceeded the average.
But for the most recent period, the situation looks quite different. From 1990 to 2014, the top 100 corporations beat the average for over half of the years and met the average 40 percent of the time. In fact, there was only one year in which the top 100’s effective tax rate actually exceeded the average for the most recent period.
So as a starting point, this figure gives a clear answer to the simple question that I posed earlier. Based on what we see here, I think it’s fairly clear that over the past couple of decades, dominant corporations have become remarkably adept at reducing their relative tax burden.
FUTURE RESEARCH
Now, I realize that what I’ve presented doesn’t even begin to scratch the surface of the political economy of corporate taxation. But I hope that what I’ve done so far serves as an effective starting point for further research. And what I want to do now is briefly conclude by raising a number of questions that I think will help guide the research project moving forward.
The first question is how reliable is this measure that I’ve used? In other words, how effective is this measure at capturing the effective tax rate? In the denominator I’ve used pre-tax income, but there’s always a risk that corporations, especially large corporations, will engage in practices such as transfer pricing to lower their pretax income. And if that’s the case, then this could distort my particular measure of the effective tax rate. So I will have to develop a number of alternative measures. One possibility will be to use sales rather than pre-tax income in the denominator and see what sort of results that yields.
The second question is how do these effective tax rates break down within the top 100? Are corporations from particular sectors causing the top 100 to consistently beat the average or is it a general phenomenon?
The third question is how does the US experience relate to patterns found elsewhere? For example, how does the effective tax rate of the top 100 US corporations compare to the top 100 corporations in the rest of the world?
And finally, assuming that the data do indeed capture something meaningful, then how do we explain what is going on here? Why have the top 100 corporations been so successful at reducing their tax rates in recent years? And what role does power play in explaining these outcomes?
Within the existing literature, the standard approach is to look for a statistically significant relationship between the two variables. If there is a meaningful quantitative relationship, then corporate power is assumed to cause lower effective rates. But the analysis basically stops there. And I think what’s needed is a more sophisticated theory of causality. In particular, there’s a need to pin down the precise mechanisms, both qualitative and quantitative, through which large corporations wield power to lower their effective tax rates.